District-wide misconception trends. Before state assessment season.
Brainpathio gives district leadership and curriculum coordinators a view of conceptual gaps across classrooms — weeks before they surface as low test scores.
Request a PilotDistrict-level view
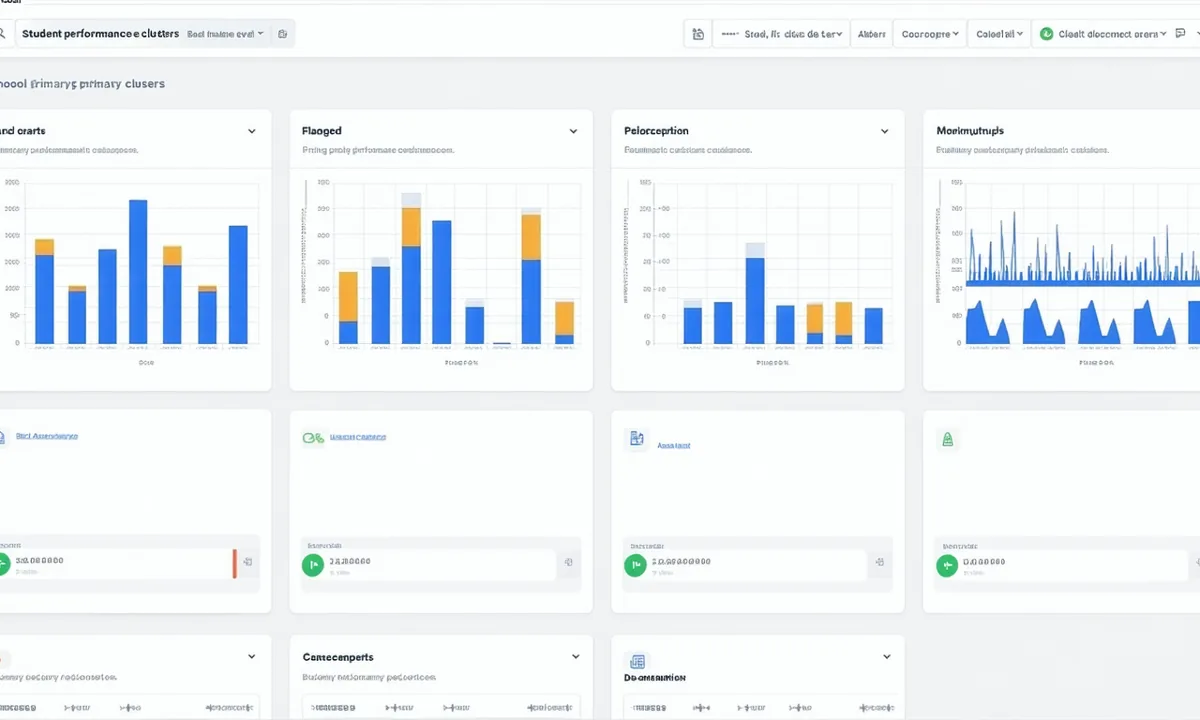
School-by-school misconception comparison, at a glance
The district dashboard aggregates misconception data across all enrolled classrooms. You see which schools have high rates of specific conceptual gaps — and which standards are most at risk before assessment windows.
- School-to-school misconception rate comparison
- At-risk classroom flags by CCSS-M domain or NGSS DCI
- Department head summary exports (PDF, CSV)
- District-level reports show aggregate misconception rates — no individual student PII in admin views
- Available in District tier and above
Return on investment
The case for misconception-aware intervention, in numbers
From our 2025-2026 pilot across 3 Portland-metro schools. All figures are preliminary and internally sourced — small sample sizes, not peer-reviewed. District results will vary based on student population, grade bands, and subject areas deployed.
Standards gap analysis
Map misconception rates to the standards your district is accountable for
Every misconception in the Brainpathio taxonomy is linked to the specific Common Core Math domain or NGSS disciplinary core idea it blocks. The district report shows which standards are most at risk before the next assessment window — letting you target professional development investment precisely.
Stop allocating PD budget to the whole curriculum. Allocate it to the three standards where your students' misconceptions are concentrated.
See full standards alignmentReady to see your district's misconception landscape?
Request a pilot with 1-3 classrooms. You'll have department-level trend data within 8 weeks.